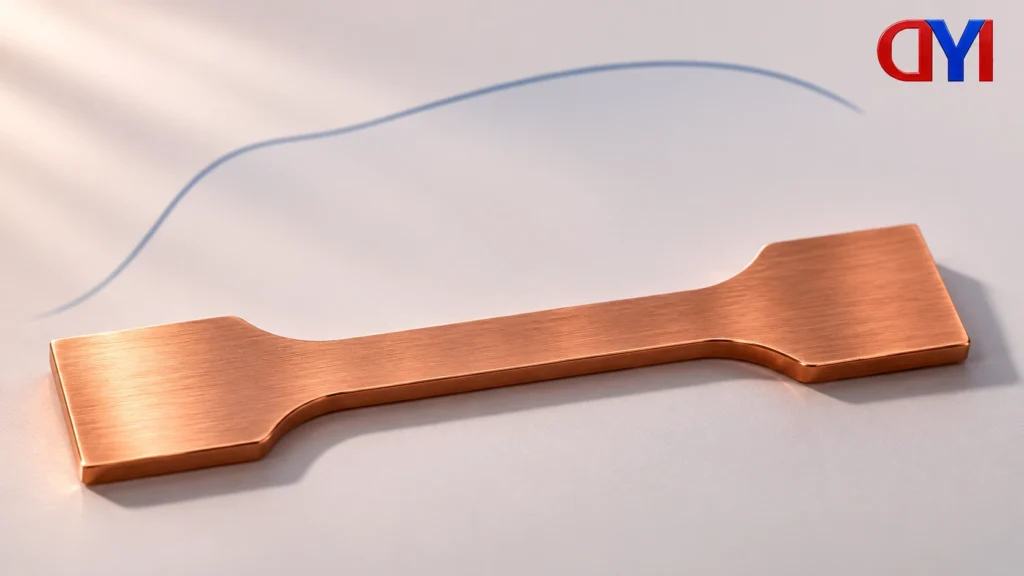
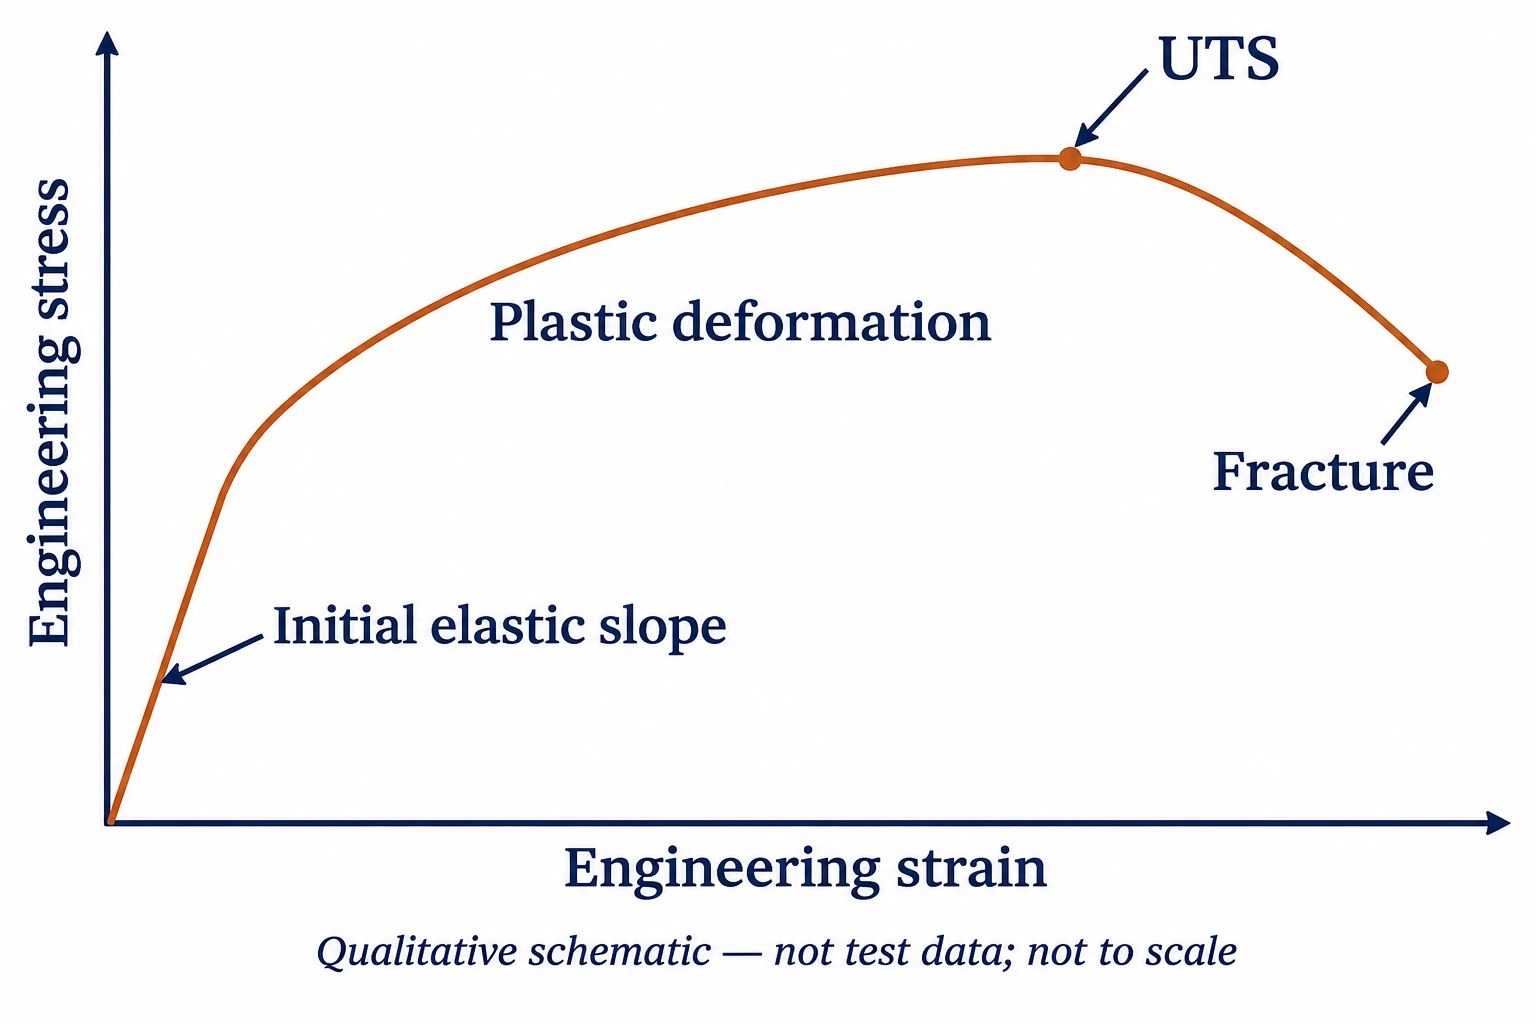
A stress strain graph plots a material’s stress against its deformation expressed as strain. For a tensile test, the initial elastic slope indicates stiffness, the yield or proof result describes the onset of specified permanent deformation, and the maximum engineering stress is the ultimate tensile strength. These are different properties, not alternative names for the same limit.
Start by checking the axes and the test description. A curve without its material grade, condition and measurement definitions cannot establish whether a metal part meets a requirement.
Read the stress strain graph axes first
Engineering stress uses the specimen’s original cross-sectional area. Engineering strain uses its original gauge length, meaning the length over which extension is measured. These normalized quantities make the graph different from a simple force-versus-displacement plot.
Engineering stress: σ = F / A0
Engineering strain: ε = ΔL / L0
Here, F is axial force, A0 is original area, ΔL is extension and L0 is original gauge length. Stress may be reported in MPa or psi. Strain is a ratio, often displayed as a percentage; check that choice before reading a slope or comparing results.
For an arithmetic example, assume a force of 500 N and an original area of 10 mm². Engineering stress is 500 ÷ 10 = 50 N/mm², equivalent to 50 MPa. An extension of 1 mm over an original 50 mm gauge length gives strain of 1 ÷ 50 = 0.02, or 2%.
These are hypothetical inputs that demonstrate the calculation. They are not test data, a copper-grade specification or an allowable operating condition. True stress uses the current area instead, so engineering and true stress values must not be treated as the same quantity.
The elastic slope describes stiffness
Young’s modulus is the slope of the initial linear elastic region: the change in stress divided by the change in strain. Elastic deformation recovers when the load is removed. A larger modulus means a greater stress is needed for the same elastic strain under the comparison conditions.
Modulus is not tensile strength. A steep initial line does not identify the highest load a finished component can safely carry. Component stiffness also involves geometry, while a material comparison needs a consistent modulus calculation method. A percentage strain axis must be converted to a ratio when calculating modulus.
Do not calculate a slope with percentage numbers unchanged
The worked example gives the same strain as either 0.02 or 2%. Those labels describe one deformation, but the printed numbers differ by a factor of 100. A calculation that divides stress by the number 2 while treating it as a dimensionless strain will therefore give the wrong units interpretation.
For illustration, 50 MPa divided by 0.02 is 2,500 MPa. Using 50 divided by 2 instead gives 25 MPa per percentage point. These are two ways of expressing the same origin-to-point slope only when the percentage-point unit is retained. They are not two different material stiffness results.
This arithmetic does not establish Young’s modulus for the hypothetical specimen. The earlier example does not say the point lies in a linear elastic region, and an origin-to-point slope through plastic deformation is not the initial elastic slope. Locate the appropriate region and use the specified evaluation method before assigning a modulus label.
Yield and proof strength identify a different transition
Plastic deformation leaves a permanent change after unloading. Some tensile curves display a distinct yield feature, while many materials have no sharp transition. A smooth curve should therefore not be forced into the familiar upper-and-lower-yield shape shown in some steel diagrams.
Where the transition is gradual, the test report may give an offset proof-strength result. An offset of 0.2% is a common example, but the applicable test specification controls the method and value. Check the reported designation rather than assuming every graph uses that offset or the same yield definition.
The peak is not necessarily the fracture point
The highest engineering stress is the ultimate tensile strength, calculated from the maximum force divided by the original specimen area. Fracture occurs where the specimen breaks. On the illustrated curve, fracture follows the maximum and occurs at a lower engineering stress; this schematic shape is not universal.
Reading only the peak misses the strain response and the yield or proof result. Likewise, a fracture-point value does not replace the maximum engineering stress. The reported result must match the property named on the drawing or purchase specification.
Compare reports before comparing metal parts
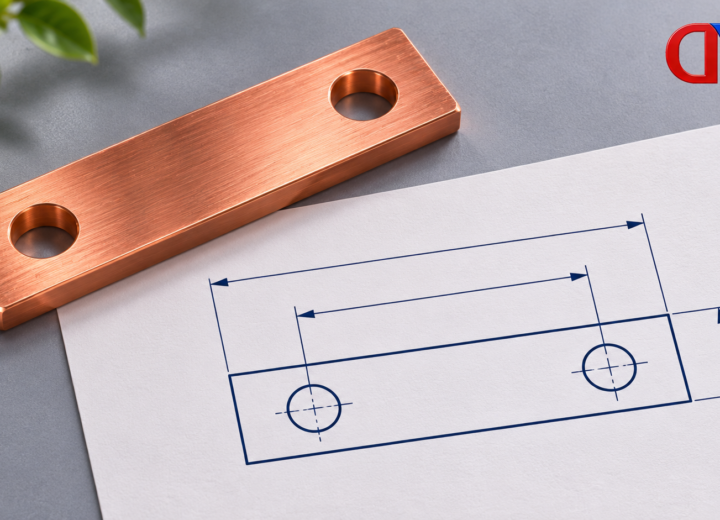
Begin with the material designation, product form and condition. Then check the test method, temperature, specimen orientation and strain measurement information provided with the results. Confirm that the units and definitions match the requirement. An unlabeled screenshot is a poor basis for accepting a material substitution.
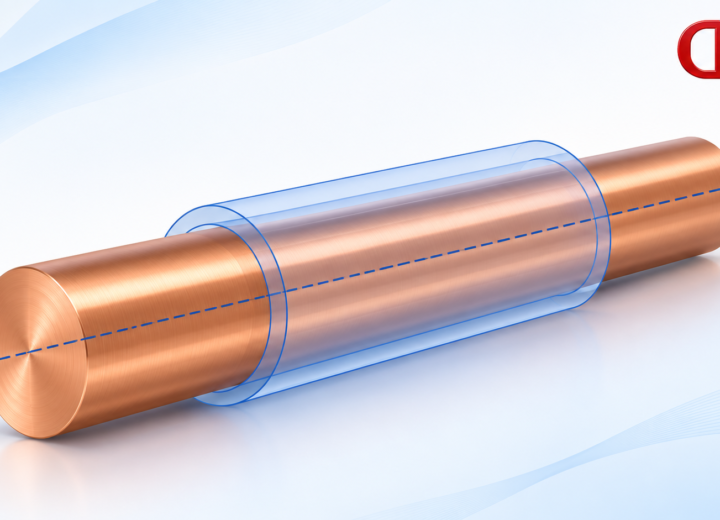
For a cylindrical component, DONGYAO’s copper rod product identifies a relevant stock form. The required grade and mechanical-property documentation still need to be specified. A generic tensile diagram does not establish that product’s measured strength or imply that a particular test was performed.
Ask the graph for the property named in the requirement
Suppose a report is being checked for three separate questions: elastic response, the specified onset of permanent change, and maximum engineering stress. The initial linear slope answers the first. The stated yield or proof result addresses the second. The peak engineering stress addresses the third. A report showing only the peak cannot resolve all three questions, even if that peak exceeds a number on the purchase document.
For a comparison between two reports, pair each named property with its definition, units and test conditions before judging the numbers. If one report gives an offset proof strength and the other an unlabeled “yield,” clarify the designation. If one screenshot uses engineering stress and another uses true stress, resolve that difference before comparing their peaks.
The same discipline applies when another test appears beside the curve. An indentation result belongs to a named hardness method and scale; it is not a tensile-curve landmark. Questions about measurement definitions and reported evidence belong with the broader manufacturing metrology framework. Keeping these results distinct makes a material report more useful than an isolated strength number.
References
NIST Technical Note 1714: Appendix A definitions; Shimadzu: stress-strain diagram features; IIT Kanpur: tensile-curve properties.
For related conductor products, view the product categories.