
In a Cp vs Cpk comparison, Cp compares specification width with process spread; Cpk also considers where the process mean sits. Ppk considers location too, but uses overall variation in the convention used here. These differences explain why a report can show a promising Cp beside a less favorable Cpk or Ppk.
The formulas below describe a two-sided, normal-capability analysis. The worked numbers are fictional and demonstrate arithmetic only. They are not DONGYAO production measurements or a supplier approval result.
Cp vs Cpk: formulas and inputs
Let USL and LSL be the upper and lower specification limits, and let x̄ be the sample mean. Use sw for an estimate of within-subgroup standard deviation and so for overall standard deviation. With that distinction, the estimated indices are:
- Cp = (USL − LSL) / (6sw)
- Cpk = min[(USL − x̄) / (3sw), (x̄ − LSL) / (3sw)]
- Ppk = min[(USL − x̄) / (3so), (x̄ − LSL) / (3so)]
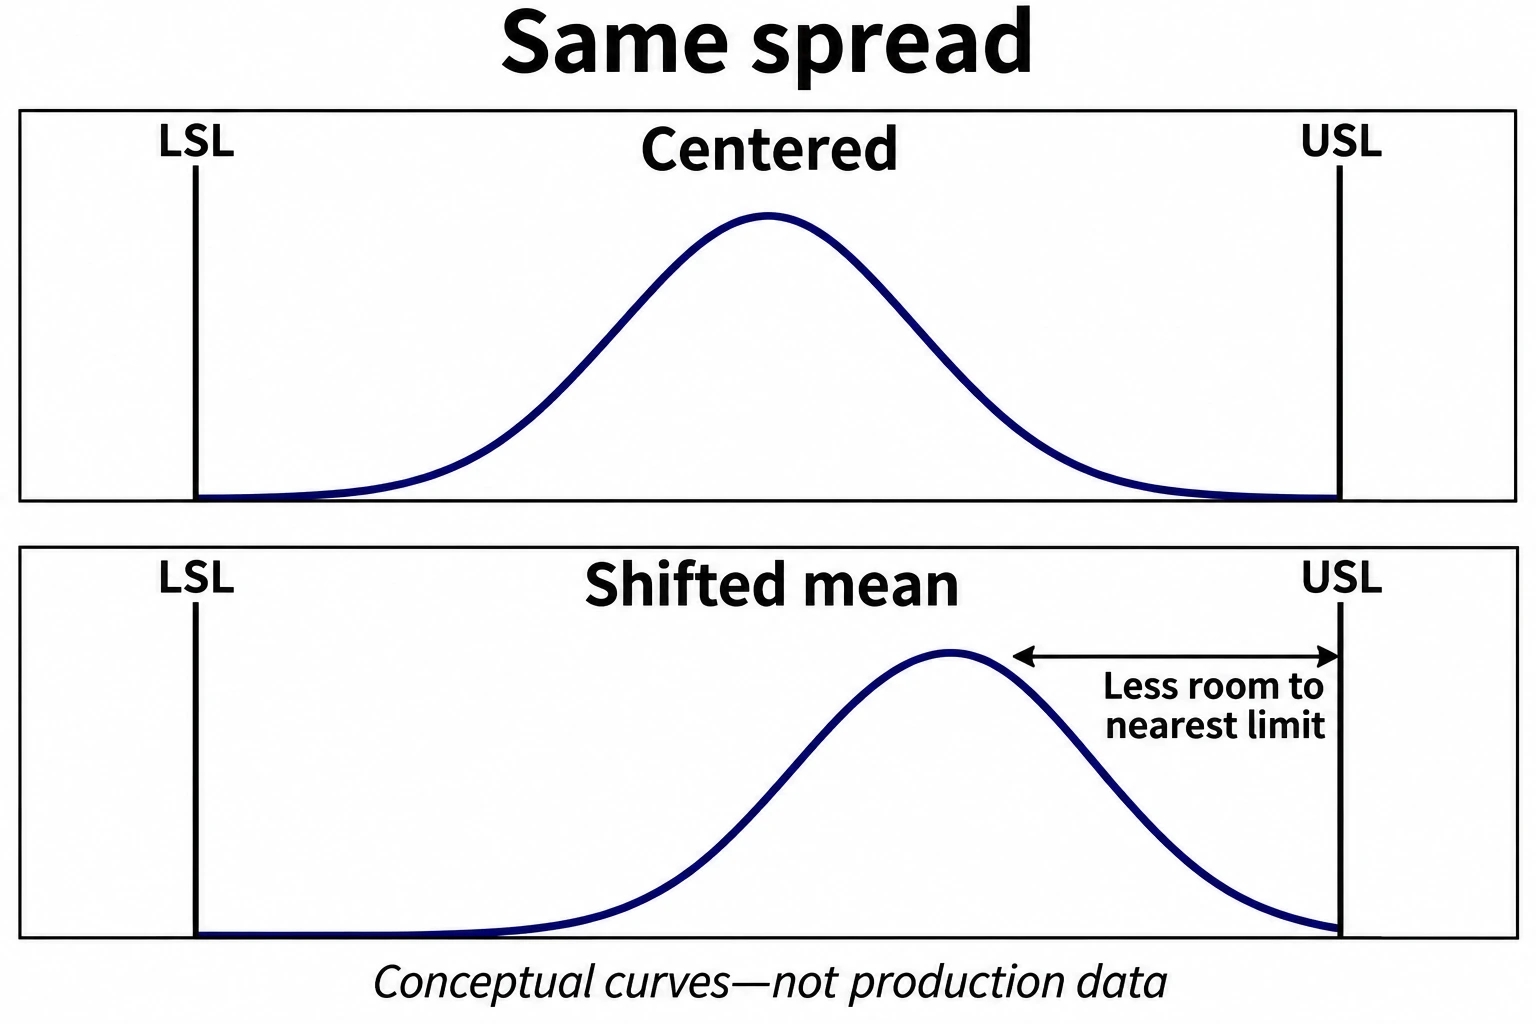
Cp uses the full specification width and ignores the mean’s location. Cpk uses the smaller distance from the mean to either limit. With unchanged limits and within spread, moving the mean away from the midpoint reduces that nearest-limit distance.
The denominators must be positive, and USL must exceed LSL. A zero spread estimate, missing limit or unsuitable distribution is a reason to review the analysis rather than force a value through these formulas. A one-sided specification needs the corresponding one-sided treatment.
Ppk vs Cpk: check the variation estimate
Within-subgroup variation describes variation inside appropriately formed subgroups. Overall variation uses the measurements across the study window. Under the normal-capability convention described in the cited software documentation, Cp and Cpk use the former; Ppk uses the latter.
If overall variation is larger than within variation, Ppk can be lower than Cpk for the same mean and limits. Investigate the data sequence, subgroup design and process history. A gap between the indices is useful evidence to investigate, but does not by itself identify the cause.
Fictional worked calculation
Assume an illustrative dimension with LSL = 9.90 mm, USL = 10.10 mm and mean = 10.04 mm. For arithmetic demonstration, assign a within standard deviation of 0.02 mm and an overall standard deviation of 0.03 mm. No raw production dataset is implied.
- Cp: (10.10 − 9.90) / (6 × 0.02) = 0.20 / 0.12 ≈ 1.67.
- Cpk: min(10.10 − 10.04, 10.04 − 9.90) / (3 × 0.02) = 0.06 / 0.06 = 1.00.
- Ppk: the same nearest-limit distance divided by 3 × 0.03 gives 0.06 / 0.09 ≈ 0.67.
The specification midpoint is 10.00 mm, while the fictional mean is closer to the upper limit. Cp does not account for that shift; Cpk does. Ppk is lower again because the assigned overall spread is larger. The calculation explains the differences without declaring the hypothetical process acceptable.
Change the fictional mean without changing the spread
Now change only the fictional mean to the specification midpoint, 10.00 mm. Keep the same limits, within standard deviation and overall standard deviation. The nearer-limit distance becomes 0.10 mm instead of 0.06 mm. Cp remains 1.67 because neither specification width nor within spread changed.
The centered Cpk is 0.10 / (3 × 0.02) ≈ 1.67. The centered Ppk is 0.10 / (3 × 0.03) ≈ 1.11. This controlled arithmetic comparison isolates centering: it improves the nearest-limit ratios without reducing either assigned standard deviation. It does not demonstrate that a real process can be centered by an adjustment or that its variation will remain unchanged.
The remaining difference between centered Cpk and Ppk comes from the two assigned spread estimates. Bringing the fictional mean to the midpoint did not make those estimates equal. Centering and reducing variation are therefore different questions, even when both appear in one improvement discussion.
Read index patterns as questions, not a diagnosis
| Reported pattern | Interpretation under the stated formulas | Follow-up |
|---|---|---|
| Cp and Cpk are equal | The mean is centered between the two limits, before rounding effects. | Check the study assumptions and actual calculation precision. |
| Cpk is below Cp | The nearer limit provides less clearance than a centered mean would have. | Review the mean location without assuming the cause of its offset. |
| Ppk is below Cpk | For the same inside-limit mean, the overall spread estimate is larger. | Review the study window, subgrouping and data sequence. |
The last row is conditional on the mean being inside the limits, as in the example. Always inspect the inputs before interpreting a ratio or its sign. An index pattern cannot tell whether the source of a change was the process, sampling or measurement. The metrology guide explains the separate need to define and support the measurement result.
What a useful capability report must explain
NIST frames capability as a comparison of a stable process with its specifications. Check stability and whether the assumed distribution and sampling approach fit the data before relying on a capability conclusion. Do not infer a defect rate from a single index while leaving those assumptions unexamined.
Request the feature and drawing revision, specification limits, study period, sampling and subgroup plan, measurement context, and method used to estimate variation. Confirm the applicable acceptance requirement rather than treating a commonly quoted index threshold as universal.
For a custom copper-bar inquiry, DONGYAO’s grounding copper-bar product provides a relevant product starting point. Define any required capability study for the actual feature and process. The listing and this fictional calculation establish no existing Cpk value, SPC certification or production guarantee.
References
- NIST: What Is Process Capability?
- Minitab: Within capability, Cp and Cpk
- Minitab: Overall capability and Ppk
For related conductor products, view the product categories.